PEM POCUS Series: Pediatric First-Trimester Pregnancy

PEM POCUS pediatric cardiac

Read this tutorial on the use of point of care ultrasonography (POCUS) for pediatric first-trimester pregnancy evaluation. Then test your skills on the ALiEMU course page to receive your PEM POCUS badge worth 2 hours of ALiEMU course credit.

Module Goals

  1. List the indications for performing an obstetric point-of-care ultrasound (POCUS)
  2. Identify the characteristic findings of an intrauterine pregnancy in the first-trimester
  3. Describe how to measure fetal heart rate (FHR) and methods of estimating gestational age using POCUS
  4. Identify findings concerning for ectopic pregnancy in the first-trimester of pregnancy

Case Introduction

A 17-year-old female with a past medical history of pelvic inflammatory disease, presents as a walk-in from triage with lower abdominal pain and vaginal bleeding that started this morning. She has soaked through three pads since this morning without the passage of clots. She reports mild nausea, and dizziness. She denies any fevers, chills, chest pain, shortness of breath, vomiting, or decreased appetite. She is currently sexually active with one male partner in a monogamous relationship and does not use protection. Her menstrual periods are irregular and she is unsure of her last menstrual period.

On arrival, her vital signs are:

Vital SignFinding
Temperature37 C
Heart rate94 bpm
Blood pressure98/62
Respiratory rate14
Oxygen saturation (room air)99%

Exam

The patient is in mild distress secondary to pain and is lying supine in the stretcher. She has mild tenderness in lower quadrants with some voluntary guarding. There is no evidence of abdominal distension, rebound, rigidity, or palpable masses. Bowel sounds are present. On the pelvic exam, she has some blood in the vaginal vault, but no clots. No abnormal discharge. There is mild tenderness on the bimanual exam. The cervical os is closed. There is no cervical motion tenderness.

Diagnostics and Management

She is started on IV fluids and is given PO acetaminophen. Vitals improve to HR 85, BP 105/70, RR 12, 99% on RA. Basic labs, PT/PTT/INR, type and screen, and a urine pregnancy test are sent. While waiting for the results, you are concerned about an ectopic pregnancy and decide to perform a point-of-care (POCUS) obstetric ultrasound examination.

An obstetric POCUS can be performed using both the curvilinear (transabdominal approach) and endocavitary probes (transvaginal approach). Certain anatomical structures such as the ovaries and an early pregnancy can be visualized earlier and with greater detail using an endocavitary probe due to its closer proximity to the area of interest. While earlier pregnancies may be identified by the transvaginal approach, we recommend starting with the transabdominal probe because it is less invasive. The transabdominal examination is best performed with a full bladder and the endocavitary examination is best performed with an empty bladder. Longitudinal and transverse views of the uterus should be obtained when using either the transabdominal or endocavitary probe.

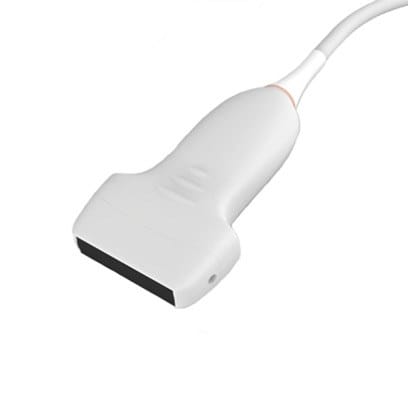
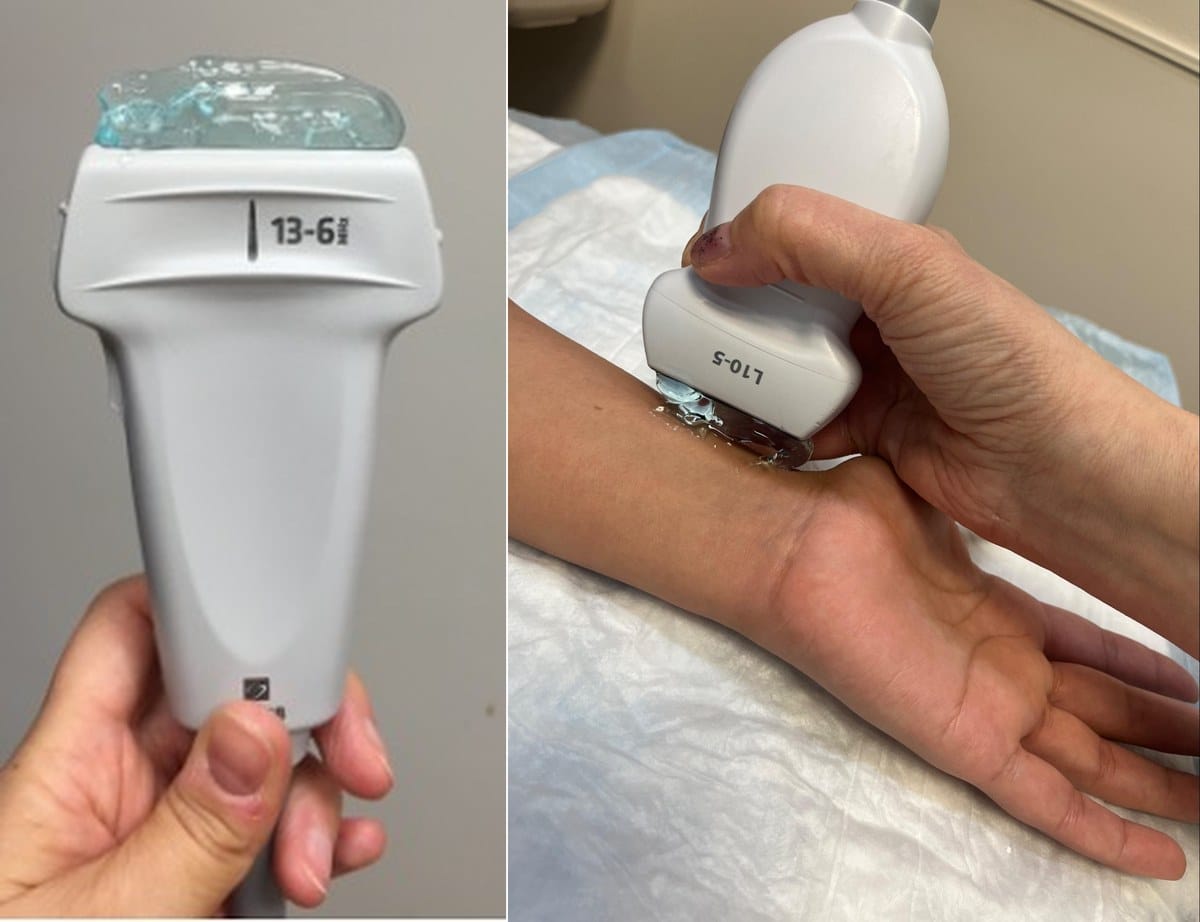
ultrasound probes

Figure 1. Different probes used for first-trimester pregnancy ultrasound

transabdominal positioning

Figure 2. Positioning for transabdominal approach

  • Position the ultrasound machine to the patient’s right with the screen facing you (figure 2).

Obtaining the transverse view

  • Place the transabdominal probe with the probe marker toward the patient’s right, just above the pubic bone and identify the bladder and uterus. The fundus of the uterus may be visualized superior to the bladder if the uterus is anteverted and posterior to the bladder if retroverted.
  • Once the uterus is identified, scan through the uterus in its entirety and identify the myometrium, and endometrium.
  • An examination of the adnexa can also be attempted to identify the ovaries, potential masses, or surrounding free fluid. The ovaries typically measure 2-3 cm in diameter and appear less echogenic than the surrounding tissue.
transabdominal view transverse

Figure 3. Normal transverse view of the uterus and bladder using the transabdominal probe. Image courtesy of The Pocus Atlas and Drs. Lindsay Davis and Hannah Koplinski

Obtaining the longitudinal (sagittal) view

  • Rotate the transabdominal probe clockwise 90 degrees so that the probe marker is facing the patient’s head.
  • In this view, you should be able to identify the bladder, uterine fundus, uterine body, cervix, vaginal canal, posterior cul-de-sac, and rectum. The thin, hyperechoic line in the center of the uterus is the endometrial stripe.
  • An examination of the adnexa may also be attempted to identify the ovaries, potential masses, or surrounding free fluid (especially in the retrouterine cul de sac) by fanning slowly left and right.
transabdominal longitudinal view pregnancy

Figure 4. Normal longitudinal (sagittal) view of an anteverted uterus and bladder using the transabdominal probe. Image courtesy of The Pocus Atlas and Drs. Lindsay Davis and Hannah Koplinski

Not all institutions have access to an endocavitary probe. However, if your institution does, the transvaginal ultrasound examination can provide additional views of the uterus and surrounding structures.

  1. Position the ultrasound machine to the patient’s right with the screen facing you, similar to the transabdominal positioning.
  2. Position the patient in the dorsal lithotomy position (similar to a normal pelvic exam), drape the patient, and have a chaperone present in the room
  3. Place gel at the tip of the endocavitary probe and apply a sterile condom or cover over the endocavitary probe. Subsequently apply sterile gel to the tip of the covered probe.

endocavitary positioning

Figure 5a. Positioning of endocavitary probe in transvaginal approach using a simulation model

Endocavitary probe

Figure 5b. Indicator labeled on endocavitary probe

Obtaining the longitudinal view

  • Hold the probe with the indicator at the 12 o’ clock position (figure 5b).
  • Slowly insert the probe until the endometrial stripe is visualized
  • Tilt/fan the probe to the left and right and identify the bladder, uterine fundus, endometrial stripe, myometrium, cervix, posterior cul-de-sac, and rectum

Obtaining the transverse view

  • Rotate the probe counterclockwise so that the indicator is facing the patient’s right (9 o’ clock position).
  • Tilt/fan the probe up and down to visualize the bladder, endometrium and myometrium.
  • Obtain a view of the ovaries by looking at the adnexa (lateral and/or posterior to the uterus).

Key Point: To definitively diagnose an intrauterine pregnancy, either a yolk sac or fetal pole must be visualized within the gestation sac of the uterus.

There are many conflicting opinions about the upper limits of the discriminatory zone (B-hCG level at which an embryo is expected to be seen). In general, for a patient with a positive B-hCG with concern for an ectopic pregnancy, an ultrasound should be performed. Typically, a pregnancy should be visible by transvaginal ultrasound examination with a B-hCG of 1000-2000 mIU/mL and by transabdominal ultrasound examination at 6000-6500 mIU/mL [1, 2].

Figure 6. Double decidual sac sign in a normal intrauterine pregnancy

Figure 7. Fetal pole and yolk sac in a normal intrauterine pregnancy

In these sonographic images, there are several characteristic sonographic features of a normal first-trimester IUP. To definitively diagnose an intrauterine pregnancy, either a yolk sac or fetal pole must be visualized within the gestation sac of the uterus.

  1. Gestational sac – an intrauterine, fluid-filled (anechoic or black) structure surrounding the embryo. This is the first structure seen in pregnancy by ultrasound in the first trimester and is characterized as an anechoic circular cavity
  2. Double decidual sac sign – consists of the decidua parietalis (lining of the uterine cavity) and the decidua capsularis (lining of the gestational sac) which on ultrasound is visualized as two concentric rings surrounding an anechoic gestational sac. The presence of a double decidual sac sign is highly indicative of an early intrauterine pregnancy (figure 6) [3].
  3. Yolk sac – this is the first anatomic structure identified within the gestational sac in the first-trimester and is seen on ultrasound as a circular, thick-walled echogenic structure with an anechoic center within the gestational sac (figure 7).
  4. Fetal pole – the growing embryo appears as an echogenic thickened margin on the edge of the yolk sac (figure 7).
  5. Ensure the gestational sac is well seated within the fundus of the uterus and surrounded by at least 5 mm of myometrium on all sides.

Once the embryo is identified, a fetal heart rate (FHR) can be obtained as early as 6 weeks of gestation. The fetal heart movement may be visualized as a flicker of movement. Visualization can be performed using either the endocavitary or curvilinear probe and the M-mode function. In POCUS, we do not use Doppler as this has a theoretical risk to the fetus.

To calculate the FHR, follow the following steps:

  1. Identify the beating fetal heart.
  2. Enlarge and center: Use the zoom function on the machine to enlarge fetal heart image
  3. M-mode: Align the M-mode line over the fetal heart, record the M-mode, and freeze the image. Find the sine wave and measure either crest to crest, or trough to trough.

A normal FHR usually ranges from 110-160 beats per minute. It begins around 90–110 bpm and increases to 170 bpm by 9 weeks of estimated gestational age.

Figure 8. Fetal heart rate measurement (rate of 148 bpm) using M-mode

The most accurate time to estimate gestational age is during the first trimester. Accurate estimation of gestational age is crucial for guiding prenatal care, decision making in high-risk pregnancies, and establishing a reliable due date. This can be performed by either measuring mean sac diameter (MSD) or crown-rump length (CRL).

Measuring mean sac diameter (MSD)

The MSD is the earliest measurement that can be used to estimate gestational age. This measurement is, however, less accurate than using crown-rump length and is typically performed between 5-8 weeks of gestation using the following steps:

  1. Obtain a longitudinal view of the gestational sac
  2. Measure the height and the length of the gestational sac
  3. Rotate the probe 90 degrees to obtain a transverse view of the gestation sac
  4. Measure the width of the gestational sac
  5. Add the height, length, and width then divide by 3 to obtain the MSD

Most ultrasound machines should help you perform this calculation; however, the gestational age can be calculated manually using the following formula: [4]

Gestational Age (days) = MSD (mm) + 30

Measuring crown-rump length (CRL)

Once an embryo is present in the gestational sac, CRL can be measured. CRL is the most accurate single measurement and is typically used to estimate gestational age between 6-13 weeks of gestation [4]. This measurement can be performed using the following steps:

  1. Obtain a mid-sagittal view of the entire embryo
  2. Measure the cephalic pole to caudal rump

Most ultrasound machines should help you perform this calculation. There are also available calculators (e.g. perinatology.com CRL calculator).

Figure 9. Crown rump length measurement showing an estimated fetal age of 6 weeks and 3 days

An ectopic pregnancy is a pregnancy in which a fertilized egg implants and grows outside the uterine cavity. The most common site for an ectopic pregnancy is the ampulla of the fallopian tube. The primary goal of performing an obstetric ultrasound in a pregnant patient who presents with abdominal pain, pelvic pain, and vaginal bleeding is not to rule in an ectopic pregnancy, but rather to rule in an IUP.

Ruling in an IUP essentially rules out an ectopic pregnancy, given that the incidence of a heterotopic pregnancy – the simultaneous occurrence of an intrauterine and an ectopic pregnancy – is 1 in 30,000. The rate of heterotopic pregnancies, however, rises significantly in patients who have undergone in-vitro fertilization (IVF) to ranges from 1 in 100 to 1 in 500 pregnancies [5]. A history of pelvic inflammatory disease also increases concern for heterotopic and ectopic pregnancy.

Uterus Views

If an empty uterus is visualized on bedside ultrasound in a patient (as shown below) with a B-hCG level greater than the discriminatory zone, the next step is to examine the adnexa for sonographic signs of an ectopic pregnancy. However, the lack of a visualized IUP on POCUS in a pregnant patient is concerning for ectopic pregnancy, and it is not expected to be able to visualize the actual ectopic pregnancy.

Video 1. Coronal (transverse) view of uterus without an intrauterine pregnancy

Video 2. Sagittal (longitudinal) view of uterus without an intrauterine pregnancy

Adnexa Views

To examine the adnexa in the transabdominal view, ensure that the patient has a full bladder and identify the uterus in the sagittal and transverse views. Using the uterus as a landmark, sweep laterally and posteriorly at which point the ovaries may or may not be visualized. Use color Doppler to help distinguish the ovary (which has a vascular hilum) from surrounding structures. Sonographic signs of an ectopic pregnancy include:

1. Tubal ring sign

A thick hyperechoic ring around a hypoechoic tubal mass

Video 3. Coronal (transverse) view of uterus showing tubal ring sign

2. Ring of fire sign

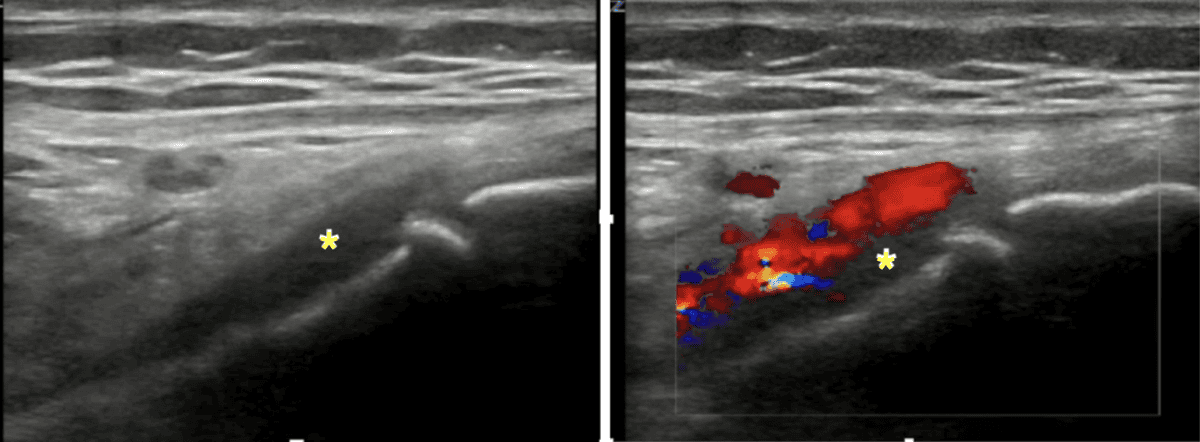
A well-circumscribed hypoechoic structure surrounded by a hypervascular ring seen on color Doppler due to trophoblastic activity and neovascularization. Note that the ring of fire sign is also present in corpus luteum cysts, which are a type of functional ovarian cyst that forms after ovulation to support a possible pregnancy.

Figure 10. Ring of fire of the adnexa

Free Fluid Assessment

If there is high suspicion for an ectopic pregnancy, assess for free fluid in the pelvis and abdomen, especially in the posterior cul-de-sac (pouch of Douglas) and hepatorenal recess (Morison’s pouch). The hepatorenal view is key for detecting hemoperitoneum in the supine patient. Fluid will often collect in Morison’s pouch first. Sweep through the pelvis in both sagittal and transverse planes to look for anechoic or hypoechoic fluid. While trace fluid may be normal in patients, the presence of moderate to large amounts of free fluid, particularly if echogenic (suggesting hemoperitoneum), raises concern for ruptured ectopic pregnancy and warrants immediate intervention. Ultimately, if the bedside ultrasound is inconclusive in a patient with clinical concern for ectopic pregnancy, a radiology performed ultrasound and/or gynecology consult should be ordered urgently.

Figure 11. Free fluid collecting in the right upper quadrant hepatorenal recess (Morison’s pouch)

Uterine fibroids, also known as leiomyomas or myomas, are benign smooth muscle tumors of the uterus. On ultrasound, they typically appear as well-circumscribed, hypoechoic (relative to the myometrium) structures that can arise within the myometrium (intramural), along the outer surface of the uterus (subserosal), project into the endometrial cavity (submucosal), and can be attached by a stalk (pedunculated).

Figure 12. Uterine fibroids

A molar pregnancy, also called a hydatidiform mole, is a type of gestational trophoblastic disease that results from abnormal fertilization, leading to the growth of abnormal trophoblastic tissue rather than a normal embryo.

A complete mole, which occurs due to fertilization of an empty ovum by one (or two) sperm, typically has a “snowstorm” or “cluster of grapes” appearance. On ultrasound, the uterus may appear larger than expected for gestational age and may show a diffusely echogenic intrauterine mass with numerous cystic spaces.

Figure 13. Molar pregnancy

An ovarian cyst is a fluid-filled sac within or on the surface of the ovary. Most are benign and functional, especially in reproductive-age women, and often resolve spontaneously.

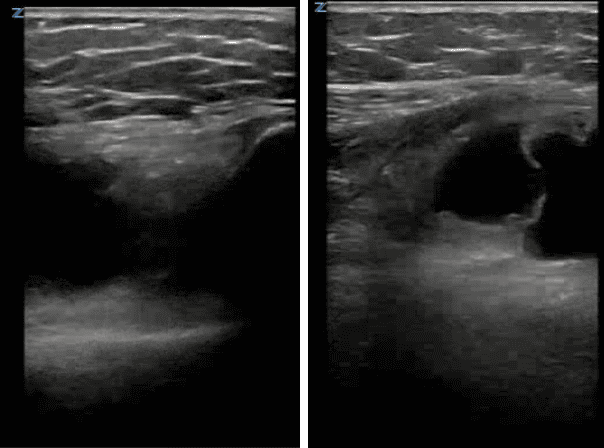
On ultrasound, simple ovarian cysts appear as a thin, smooth-walled anechoic structure. A corpus luteum cyst, which may have a “ring of fire” appearance on color Doppler, is more thick-walled in appearance. Hemorrhagic cysts tend to have mixed echogenicity with a lacy, reticular pattern.

Figure 14. Ovarian cysts

Ovarian torsion is often on the differential for female patients presenting with sudden onset lower abdominal pain. It is a gynecologic emergency where the ovary twists on its own vascular pedicle, compromising blood flow. Patients with large ovarian cysts or masses ≥5cm are at increased risk.

On ultrasound, an enlarged, edematous ovary with absent or decreased flow may suggest this diagnosis. The ovary also tends to have peripheralized follicles. A midline ovary can also be a concerning sign. Venous flow is typically lost prior to arterial flow; however, presence of flow does not rule out ovarian torsion. Lastly, a highly specific finding for ovarian torsion may be the presence of a whirlpool sign which is visualized as a targetoid, coiled structure on color Doppler.

Figure 15. Ovarian torsion with midline, edematous ovary

Integration of the obstetric POCUS into early pregnancy assessment can significantly accelerate diagnosis and initiation of treatment, particularly in urgent cases like an ectopic pregnancy. Faster timelines could translate into improved clinical outcomes and more efficient ED workflows.

Studies that helped shape the landscape for the utility of POCUS in early pregnancy in the emergency department setting include:

StudyStudy Type, Location (Time frame)N, AgesNotes
Doubilet et al., N Engl J Med. 2013 [6]Review ArticleN/AThis review establishes more stringent ultrasound criteria for diagnosing early pregnancy failure to minimize false-positive results:

  • CRL ≥7 mm without heartbeat or MSD ≥25 mm without embryo confirm a nonviable pregnancy.
  • Equivocal findings trigger serial scans and hCG monitoring to safely evaluate uncertain cases.

These guidelines are designed to protect viable pregnancies from premature or inappropriate interventions.

Thamburaj et al. Pediatr Emerg Care. 2013 [7]Retrospective case-cohort review, Single ED at Newark Beth Israel Medical Center (2007)330 Female patients aged 13-21

Bedside POCUS group (n = 244, ~74%; Radiology group (n = 86)

Time-to-scan: 82 min vs. 149 min (POCUS vs. radiology), P < 0.001

LOS: 142 min vs. 230 min (P < 0.001)

Despite similar demographics, chief complaints, diagnoses, and dispositions between groups, bedside ultrasound significantly reduced both scan time and overall ED stay.

McRae et al. CJEM. 2009 [8]Systematic review, multiple EDs including international dataN/AED-targeted ultrasound is highly specific and reliably identifies IUP. The specificity for detecting IUP exceeded 98% in most studies, and sensitivity typically above 90%.

Bedside ultrasound reduced missed ectopic diagnosis, decreased time to surgical treatment for ectopic cases, shortened ED lengths of stay in normal pregnancies, and showed greater cost-effectiveness versus formal radiology ultrasound.

Durston et al. Am J Emerg Med. 2000 [9]Retrospective cohort, single-center (1992-1998)120 patients diagnosed with ectopic pregnancyCompared 3 different ultrasound availability models over sequential time periods:

  1. Radiology-performed ultrasound only
  2. Limited ED physician-performed ultrasound availability
  3. Full ED physician-performed bedside ultrasound availability

Increasing ED ultrasound availability improved the quality of ectopic pregnancy detection.

The combined approach of initial ED physician bedside ultrasound followed by formal imaging when indicated was the most cost-effective and efficient.

Mateer et al. Acad Emerg Med. 1995 [10]Prospective cohort, single-center148 pregnant women at risk for ectopic pregnancyEmergency physicians trained in bedside transvaginal ultrasound (TVUS) demonstrated a 93% agreement rate with gynecologists in interpreting scans. Most ectopic pregnancies were identified early, allowing prompt management.

Established feasibility and high accuracy of ED physician-performed POCUS for early pregnancy evaluation, promoting wider adoption in emergency care.

Beals et al. Am J Emerg Med. 2019 [11]Systematic review, multi-center2,350 patients across 6 studiesPatients who received POCUS had a mean reduction in ED LOS of 73.8 minutes (95% CI: 49.1–98.6) compared to those who underwent comprehensive ultrasound.

All included studies reported decreased LOS with POCUS.

Table 1. Key published studies on first-trimester obstetric POCUS

Case Resolution

You use a curvilinear abdominal probe (Figure 16) and endocavitary probe (Figure 17) and visualize the following:

ring of fire ultrasound adnexa

Figure 16. Right adnexal view showing a “ring of fire” sign suggestive of an ectopic pregnancy

Figure 17. Sagittal view of uterus showing the absence of an intrauterine pregnancy

Given her initial low blood pressure and an obstetric ultrasound concerning for an ectopic pregnancy, you decide to perform a FAST exam, and you see free fluid in the hepatorenal recess.

Figure 18. Right upper quadrant abdominal view, showing free fluid in Morison’s pouch

ED Course

Serum labs show the following:

  • hCG 8400 mIU/mL
  • WBC 13.3 x 10³/uL
  • Hematocrit 25.1%

The obstetrics and gynecology team is consulted for a likely ectopic pregnancy, and the patient is taken to the OR for an emergent laparotomy.

References

  1. Hamza A, Meyberg-Solomayer G, Juhasz-Böss I, et al. Diagnostic Methods of Ectopic Pregnancy and Early Pregnancy Loss: a Review of the Literature. Geburtshilfe Frauenheilkd. 2016;76(4):377-382. doi:10.1055/s-0041-110204
  2. Kadar N, DeVore G, Romero R. Discriminatory hCG zone: its use in the sonographic evaluation for ectopic pregnancy. Obstet Gynecol. 1981;58(2):156-161. PMID: 7254727
  3. Rodgers SK, Chang C, DeBardeleben JT, Horrow MM. Normal and Abnormal US Findings in Early First-Trimester Pregnancy: Review of the Society of Radiologists in Ultrasound 2012 Consensus Panel Recommendations. Radiographics. 2015;35(7):2135-2148. doi:10.1148/rg.2015150092
  4. Weissleder R, Wittenberg J, Harisinghani MG, Chen JW. Primer of Diagnostic Imaging. 5th ed. Mosby/Elsevier; 2011. ISBN: 9780323065382
  5. Habana A, Dokras A, Giraldo JL, Jones EE. Cornual heterotopic pregnancy: contemporary management options. Am J Obstet Gynecol. 2000;182(5):1264-1270. doi:10.1067/mob.2000.103620. PMID: 10819869
  6. Doubilet PM, Benson CB, Bourne T, Blaivas M. Diagnostic Criteria for Nonviable Pregnancy Early in the First Trimester. N Engl J Med. 2013;369(15):1443-1451. doi:10.1056/NEJMra1302417
  7. Thamburaj R, Sivitz A. Does the use of bedside pelvic ultrasound decrease length of stay in the emergency department? Pediatr Emerg Care. 2013;29(1):67-70. doi:10.1097/PEC.0b013e31827b53f9. PMID: 23283267
  8. McRae A, Murray H, Edmonds M. Diagnostic accuracy and clinical utility of emergency department targeted ultrasonography in the evaluation of first-trimester pelvic pain and bleeding: a systematic review. CJEM. 2009;11(4):355-364. doi:10.1017/s1481803500011416. PMID: 19594975
  9. Durston WE, Carl ML, Guerra W, Eaton A, Ackerson LM. Ultrasound availability in the evaluation of ectopic pregnancy in the ED: comparison of quality and cost-effectiveness with different approaches. Am J Emerg Med. 2000;18(4):408-417. doi:10.1053/ajem.2000.7310. PMID: 10919529
  10. Mateer JR, Aiman EJ, Brown MH, Olson DW. Ultrasonographic examination by emergency physicians of patients at risk for ectopic pregnancy. Acad Emerg Med. 1995;2(10):867-873. doi:10.1111/j.1553-2712.1995.tb03099.x. PMID: 8542485
  11. Beals T, Naraghi L, Grossestreuer A, Schafer J, Balk D, Hoffmann B. Point of care ultrasound is associated with decreased ED length of stay for symptomatic early pregnancy. Am J Emerg Med. 2019;37(6):1165-1168. doi:10.1016/j.ajem.2019.03.025. PMID: 30948256

PRoMPT BOLUS: A Landmark PECARN Trial Defining Fluid Choice in Pediatric Sepsis

Two IV fluid bags labeled 0.9% sodium chloride and lactated Ringer's hanging side by side in a pediatric emergency department

Article reviewed: Balamuth F, Weiss SL, Long E, et al; PRoMPT BOLUS Investigators of the PECARN, PERC, and PREDICT Networks. Balanced Fluid or 0.9% Saline in Children Treated for Septic Shock. N Engl J Med. Published online April 24, 2026
DOI: 10.1056/NEJMoa2601969  |  PubMed: PMID 42028918

For years, clinicians and researchers have debated a fundamental question in pediatric emergency care: does the type of fluid used in pediatric sepsis resuscitation matter?

The PRoMPT BOLUS trial was designed to answer this question. Conducted across 47 international sites in 5 countries and enrolling more than 9,000 children, this large, pragmatic randomized trial compared 0.9% saline with balanced crystalloids in children treated for suspected septic shock.

The results have just been released. Across a wide range of clinically meaningful outcomes (including kidney injury, mortality, and recovery), there was no difference between fluid types.

Background

Sepsis remains a major global health concern, affecting approximately 50 million people each year, with children accounting for nearly half of these cases. Early fluid resuscitation is a cornerstone of treatment, making the choice of fluid a critical and historically debated decision.

Two primary types of crystalloid fluids are used in practice:

  • 0.9% saline, which contains a higher-than-physiologic chloride concentration
  • Balanced fluids (such as lactated Ringer’s, Hartmann’s solution and PlasmaLyte), which more closely resemble plasma electrolyte composition

Prior research raised concerns that saline could contribute to metabolic acidosis and kidney injury, while balanced fluids were associated with improved outcomes in some adult and smaller pediatric studies. However, the pediatric literature remained inconsistent, with observational studies reaching conflicting conclusions. As a result, guidelines offered only weak recommendations favoring balanced fluids and called for more definitive trials.

PRoMPT BOLUS was designed to fill this gap.

Study Design

This trial used a pragmatic, randomized design (NS vs. balanced fluids), intentionally embedded into routine clinical care. Pragmatic trials evaluate clinical interventions within typical practice, rather than highly controlled clinical settings. By incorporating fluid randomization without modifying additional aspects of clinical practice, this approach allowed investigators to study fluid choice in real-world conditions across diverse healthcare systems. PRoMPT BOLUS was a collaborative effort across multiple networks including PECARN (Pediatric Emergency Care Applied Research Network), PERC (Pediatric Emergency Research Canada), and PREDICT (Paediatric Research in Emergency Departments International Collaborative).

Children ages 2 months to <18 years were eligible if clinicians suspected sepsis and were planning to treat with more than one fluid bolus for abnormal perfusion consistent with septic shock. They were randomized to receive either balanced fluids or 0.9% saline, with clinicians otherwise managing care as they normally would.

The primary outcome was MAKE30 (Major Adverse Kidney Events within 30 days), a composite that includes mortality, need for renal replacement therapy, or persistent kidney dysfunction at hospital discharge or 30 days, whichever came first.

This pragmatic approach was critical to the study’s success. It allowed for:

  • High enrollment across multiple international sites
  • Enrollment at the beginning of sepsis resuscitation so that most early fluid was as randomized
  • Strong generalizability to everyday clinical practice
  • Minimal disruption to clinical workflows

Results

Primary Outcome

The primary outcome, MAKE30, occurred at nearly identical rates in both groups:

  • Balanced fluids: 3.4%
  • Saline: 3.0%

This difference was neither statistically nor clinically significant. There were also no differences in any of the individual MAKE30 components between treatment groups.

Secondary and Safety Outcomes

Similarly, there were no meaningful differences in:

  • Mortality
  • Hospital length of stay
  • Hospital-free days (median of 23 days in both groups)
  • Safety events such as thrombosis or cerebral edema

Together, these findings strongly support the conclusion that both fluids are equally safe and effective.

Biochemical Differences

Although there were measurable and statistically significant biochemical differences between groups (such as higher rates of hyperchloremia and hypernatremia with saline and hyperlactatemia with balanced fluids), these changes did not translate into clinically meaningful outcomes.

Subgroup Analyses

Subgroup analyses across patient characteristics, illness severity, and total fluid volume showed no differences in outcomes. While there was a non-significant trend suggesting potential benefit of balanced fluids in the most severely ill patients, the study was not powered to confirm this finding.

Major Findings

The results of PRoMPT BOLUS can be distilled into several key conclusions:

  • Both 0.9% saline and balanced fluids are safe and effective for treatment of children with suspected septic shock
  • Fluid type does not influence major clinical outcomes, including mortality or kidney injury
  • Biochemical differences exist between fluid choices, but did not translate to differences in clinical outcomes

Importantly, while the study cannot fully exclude a benefit of balanced fluids in the sickest patients, it provides strong evidence that for children presenting to the ED with suspected sepsis, either fluid is an appropriate choice.

Clinical Implications

These findings have immediate and meaningful implications for clinical practice.

First, they simplify decision-making. Clinicians can focus on timely recognition and treatment of children with suspected sepsis, and engage in fluid resuscitation with fluids that make sense for the clinical scenario.

Second, the results support flexibility in care. Fluid choice can now be guided by:

  • Availability
  • Medication compatibility
  • Patient-specific factors (e.g., electrolyte abnormalities, underlying conditions)

Limitations

While the study is robust, several limitations should be considered.

The overall incidence of MAKE30 was lower than expected (~3% vs. an anticipated ~6%), which may reflect a less severely ill population than initially projected. This could limit the ability to detect small differences between groups.

Additionally, although subgroup analyses suggested a possible benefit of balanced fluids in more severely ill patients, the study was not powered to draw definitive conclusions in this population.

Bottom Line

The PRoMPT BOLUS trial provides the strongest evidence to date addressing fluid choice in children presenting to the ED with suspected sepsis. Both 0.9% saline and balanced crystalloids are safe and effective for resuscitation in children with suspected septic shock.

References

  1. Balamuth F, Weiss SL, Long E, et al; PRoMPT BOLUS Investigators of the PECARN, PERC, and PREDICT Networks. Balanced Fluid or 0.9% Saline in Children Treated for Septic Shock. N Engl J Med. Published online April 24, 2026. doi:10.1056/NEJMoa2601969
By |2026-05-04T21:19:59-07:00May 7, 2026|Critical Care/ Resus, Pediatrics|

Who Gets Mistriaged? Disparities in Pediatric Behavioral Health ED Triage | A PECARN multicenter analysis

mistriaging of pediatric mental health conditions with ESI
A 14-year-old Hispanic girl presents to the Emergency Department with her mother for suicidal ideation after a conflict at home. The girl is quiet and cooperative. Her mother, who speaks primarily Spanish, is trying to explain the situation. The nurse assigns an ESI level 2, the same score given to nearly every child who walks through the door with a behavioral health complaint. But does that score accurately capture this patient’s needs?

A new multicenter PECARN study published this week in JAMA Network Open takes a close look at triage accuracy for pediatric behavioral health ED visits. The findings: mistriaging errors are common, and they are not equally distributed [1].

Hoffmann et al. analyzed 78,411 ED visits by children aged 5 to 17 with behavioral health chief concerns across 15 PECARN Registry EDs from 2021 to 2023 [1]. They classified each visit as appropriately triaged, overtriaged, or undertriaged using vital signs, Glasgow Coma Scale, pain scores, emergency medication use, resource utilization, and disposition. Of the 74,564 visits with complete data:

  • 57% were overtriaged
  • 34% were appropriately triaged
  • 8.5% were undertriaged

How ESI Handles Behavioral Health

The Emergency Severity Index (ESI) is used in over 90% of US EDs [2]. It sorts patients into 5 acuity levels. Level 1 is for patients needing lifesaving interventions. Level 2 is for high-risk situations, confused patients, or those in severe pain. Levels 3 through 5 are based on anticipated resource needs. In this study, 83.5% of all behavioral health visits were triaged as ESI level 2.

To assess triage accuracy, the authors compared each child’s assigned ESI level against what actually happened during their visit.

Overtriage

Overtriage means a child was assigned a higher acuity score than their clinical course supported. For a child assigned ESI level 2, overtriage was defined as meeting ALL of the following [1]:

  • Stable vital signs within 2 hours of arrival (heart rate and respiratory rate not high risk for age, SpO2 ≥93% or not recorded)
  • Pain score <7 (or not recorded)
  • GCS of 15 (or not recorded)
  • No emergency medications during the visit

In other words, the triage nurse predicted high acuity, but the visit didn’t bear that out.

Undertriage

Undertriage means the opposite: a child was assigned a lower acuity score than their clinical course warranted. For example, a child triaged as ESI level 4 (expected to need 1 resource) who ended up being admitted, needing emergency medications, or using multiple resources. The triage nurse underestimated how sick the child was or how much care they would need.

Undertriage Disproportionately Affects Minority Children and Spanish-Speaking Families

The most concerning equity finding was in undertriage.

After adjusting for clinical and visit characteristics, undertriage was significantly more likely for Hispanic children (AOR 1.46), non-Hispanic Black children (AOR 1.28), and children whose families preferred Spanish (AOR 1.31), all compared to non-Hispanic White and English-speaking patients [1]. The authors point to implicit clinician bias, systemic racism, and underutilization of professional interpreters as likely contributors.

The safety implications are real. Children whose acuity is underestimated may face longer waits, miss time-sensitive interventions, or leave the ED without being seen despite elevated risk.

Overtriage Was Common

More than half of all visits (57%) were overtriaged [1]. These children received a higher acuity triage score than their clinical course supported.

The strongest predictor was age. Children aged 5-9 had over 4-fold higher adjusted odds of overtriage compared to those aged 10-14 (AOR 4.43), possibly because younger children have a limited ability to communicate their symptoms and needs.

To a lesser degree, non-Hispanic Black children also had higher adjusted odds of overtriage compared to non-Hispanic White children (AOR 1.17). The authors cite research on adultification, the tendency to perceive Black youth as older or more threatening than they are, as a potential contributor. This means Black children in this study were more likely to be both undertriaged and overtriaged compared to White children. The errors are not unidirectional. They likely reflect different biases operating at different points in care.

Take Home Points

  1. The ESI has limited ability to differentiate pediatric behavioral health presentations. In this study, 83.5% of behavioral health visits were triaged as ESI level 2.
  2. UNDERTRIAGE was more likely for Hispanic children (AOR 1.46), non-Hispanic Black children (AOR 1.28), and Spanish-speaking families (AOR 1.31), raising concerns about missed acuity in these groups.
  3. OVERTRIAGE occurred in 57% of visits, driven most strongly by younger age (AOR 4.43 for ages 5 to 9) and to a lesser degree by non-Hispanic Black race (AOR 1.17).

References

  1. Hoffmann JA, Foster AA, Rojas CR, et al. Overtriage and undertriage of children presenting to the emergency department for behavioral health. JAMA Netw Open. 2026;9(3):e263042. Full text
  2. McHugh M, Tanabe P, McClelland M, Khare RK. More patients are triaged using the Emergency Severity Index than any other triage acuity system in the United States. Acad Emerg Med. 2012;19(1):106-109. doi:10.1111/j.1553-2712.2011.01240.x
By |2026-03-28T19:43:20-07:00Mar 28, 2026|Pediatrics, Psychiatry|

SAEM Clinical Images Series: Can I Snooze on This Bruise?

The patient is a 21-month-old male with no medical problems who is brought into the Emergency Department with concerns for bruising of the lower extremities and swelling of feet. His parents noticed the patient was walking differently 4 days ago and then noted bruising and edema of his feet bilaterally. They state there has been no known injury or trauma, and at least one of the parents has been with the child at all times. The bruising has spread and darkened to become widespread on both legs and today they noticed a few new spots on his arms and face. They report some possible subjective fevers and mild congestion, but there have been no other symptoms. There has been no recent weight loss and there is no history easy bleeding.

Vitals: HR 150, RR 28, Temp 98.1, O2sat 100% room air.

General: Awake, alert. Appears uncomfortable but in no acute distress.
Respiratory: Breath sounds normal. No increased work of breathing.
Cardiovascular: Mild regular tachycardia, no murmur.
Abdominal: Abdomen soft. There is no tenderness. No organomegaly.
Neurologic: At neurologic baseline. No focal deficits.
Skin: See images provided. Image 1 was on the first day of illness,
whereas Images 2 and 3 were taken on day four of the illness.

CBC: WBC 10.3, Hgb10.9, Plt 412,000

Creatinine normal at 0.25.

Urinalysis without blood or protein.

Acute Hemorrhagic Edema of Infancy (AHEI).

Acute Hemorrhagic Edema of Infancy (AHEI) is a small vessel vasculitis characterized by palpable purpuric skin lesions, edema, and fever. AHEI normally develops in children between the ages of 4 months to 2 years, as opposed to Henoch-Schönlein Purpura, which is more typical in children 2-10 years of age (peak age 4-6). Triggers can include infections, medications including penicillin, cephalosporins, and Trimethoprim- sulfamethoxazole, and immunizations. Clinical features are often preceded by a mild prodromal illness, followed by the rapid development of palpable purpura, ecchymosis, and petechia over 24-48 hours that is distributed mainly on the extremities and face, specifically the ears, eyelids and cheeks. The mucus membranes and the trunk are spared. Because AHEI is an immune-mediated vasculitis, internal organ involvement is possible, although rare, and can include nephritis, arthritis, and gastrointestinal tract problems. Diagnosis of AHEI is clinical, although other serious conditions must be considered in the differential such as non-accidental trauma, leukemia, and Kawasaki Disease. AHEI is a self-limited disease that resolves spontaneously over 1-3 weeks.

Take-Home Points

  • AHEI is characterized by palpable purpuric skin lesions, edema and fever. It is distinguished from HSP clinically primarily by the age of onset, with HSP affecting children usually from age 2-10 years.
  • Serious conditions such as non-accidental trauma, leukemia, and Kawasaki Disease should be considered and excluded.

  • Cunha DF, Darcie AL, Benevides GN, Ferronato AE, Hein N, Lo DS, Yoshioka CR, Hirose M, Cardoso DM, Gilio AE. Acute Hemorrhagic Edema of Infancy: an unusual diagnosis for the general pediatrician. Autops Case Rep. 2015 Sep 30;5(3):37-41. doi: 10.4322/acr.2015.020. PMID: 26558246; PMCID: PMC4636105.
  • Jindal SR, Kura MM. Acute hemorrhagic edema of infancy-a rare entity. Indian Dermatol Online J. 2013 Apr;4(2):106-8. doi: 10.4103/2229-5178.110630. PMID: 23741666; PMCID: PMC3673373.

By |2026-01-06T10:05:22-08:00Jan 9, 2026|Pediatrics, SAEM Clinical Images|

Gamechanger: Do we really need a lumbar puncture for all febrile infants 0-28 days old?

PECARN febrile infant rule age 0-28 days

A new international pooled analysis challenges the age-old dogma that all febrile infants 0-28 days require a lumbar puncture (LP). Can the PECARN febrile infant prediction rule safely identify a low-risk subset for invasive bacterial illnesses (bacterial meningitis and bacteremia) [1]?

Bottom Line

For more than  four decades, the standard of care for febrile infants in the first month of life has been aggressive: full sepsis workup (including an LP), admission, and IV antibiotics. A new study in JAMA suggests this paradigm may be shifting [2, 3].

  • In an international pooled analysis of more than  1,500 febrile infants aged ≤28 days, the updated PECARN febrile infant prediction rule missed zero cases of bacterial meningitis.
  • Inclusion Criteria: Non-ill-appearing, full time (≥37 weeks) infants aged 0–28 days with fever (≥38.0°C), who underwent blood and urine testing including procalcitonin (PCT).
  • Exclusion Criteria: Critically ill appearance, prematurity, comorbidities, or antibiotic use in preceding days.
  • Implication: Cerebrospinal fluid analysis is unnecessary for a subset of non-ill-appearing febrile infants ≤28 days old.
  • What now? The current data provides a solid, practice-changing, evidence-based foundation for a shared decision-making conversation that wasn’t possible before.

Study

To answer this question, the authors performed 2 distinct analyses:

  1. Primary Analysis (The “External” Test): To test the rule’s validity in new, diverse populations, the primary analysis pooled data from 4 prospective international cohort studies (Canada, Spain, Europe, UK/Ireland).
    • Population: 1,537 non-ill-appearing, full-term (≥37 weeks) infants aged 0–28 days with fever (≥38C)
    • Why no US data? This was done to validate the PECARN rule externally, avoiding the bias of testing it on the same US population from which it was derived.
  1. Secondary Analysis (The “Maximize Power” Test): To generate the most precise safety estimates possible, the authors then pooled the 4 international cohorts PLUS the 2 original US-based PECARN cohorts.
    • Population: 2,531 infants total
    • Result: Even with the added US data, the rule missed zero cases of bacterial meningitis.

What is the updated PECARN febrile infant prediction?

An infant ≤28 days old is low risk if they meet all 3 criteria:

  1. Urinalysis: Negative
  2. Absolute neutrophil count (ANC): ≤4,000/mm3
  3. Serum procalcitonin: ≤0.5 ng/mL

The Findings

The prevalence of Invasive Bacterial Infections (IBI) in all studied patients was 4.5%.

  • 3.8% bacteremia
  • 0.7% meningitis

Performance of the PECARN Rule

MetricPrimary Analysis of 4 International Cohorts (95% CI)Secondary Analysis of 4 International + 2 US PECARN Cohorts (95% CI)
Total Infants1,5372,531
Classified as “Low Risk”632 (41.1%)1,079 (42.6%)
Sensitivity94.2%
(85.6–97.8%)
94.8%
(88.1–97.8%)
Specificity41.6%
(36.7–46.7%)
43.3%
(38.7–48.0%)
Negative Predictive Value (NPV)99.4%
(98.1–99.8%)
99.6%
(98.7–99.9%)
Positive Predictive Value (PPV)6.9% ( 4.8–9.9%)6.1%
(4.5–8.2%)
Missed Meningitis Cases0 (out of 11 cases)0 (out of 22 cases)
Missed Bacteremia Cases4 (5.8% of IBI cases)5 (5.3% of IBI cases)

Number needed to tap calculation

One of the most compelling arguments for using this rule is the statistical trade-off required to find a single missed case. The authors provide estimated Negative Predictive Values (NPV) across a range of disease prevalences.

If we assume a 1.00% prevalence of bacterial meningitis (which is conservative; the study observed 0.7%), the NPV for bacterial meningitis is 99.95% [2].

This means that for every 10,000 PECARN low-risk infants, 9,995 do not have bacterial meningitis, and 5 might. We can translate this into a “Number Needed to Tap” (NNT) to find one missed case:

  • Risk of Missed Case = 1 – 0.9995 = 0.0005
  • NNT = 1 / 0.0005 = 2000

Bottom Line: You would hypothetically need to perform 2,000 lumbar punctures on low-risk infants to find ONE case of bacterial meningitis that the rule missed.

Important guardrails: Who is this rule for?

Before applying these findings, we need to understand the strict inclusion criteria. This study—and the PECARN rule itself—was only validated on a specific population.

The “Must-Have” Checklist:

  • Non-ill-Appearing: The infant cannot appear ill. The study defined this strictly, excluding infants with abnormal appearance, work of breathing, or circulation findings (often using the Pediatric Assessment Triangle or other illness indicators). If the baby looks sick, the rule does not apply.
  • Full-Term: Infants must be ≥37 weeks gestation. Preterm infants have different immunological risks and were excluded.
  • Age 0–28 Days: This specific analysis focused exclusively on the first 28 days of life.
  • ✅ Proven Fever: Documented temperature ≥38C

The SBI vs. IBI distinction

If you are already using the PECARN rule for older infants (29–60 days), you likely use it to rule out Serious Bacterial Infections (SBIs), which includes urinary tract infections (UTIs) [1].

This study is different – it focused purely on invasive bacterial infections (IBIs), which is defined as bacteremia and/or bacterial meningitis.

What did the PECARN rule miss?

The rule had perfect sensitivity for bacterial meningitis, but it did miss 5 cases of bacteremia out of more than 2,500 infants ≤28 days old despite a low-risk stratification. Let’s look at the 5 cases classified as “missed bacteremia:

  • 1 case: H. influenzae bacteremia
  • 1 case: E. coli bacteremia (without UTI)
  • 1 case: E. coli bacteremia (with E. coli UTI)
  • 2 cases: S. aureus bacteremia (One of these also had a concurrent E. coli UTI).

The authors note that S. aureus in blood cultures can be a contaminant rather than a true pathogen. If these S. aureus cases were indeed contaminants, the true sensitivity of the rule would be even higher than reported.

Notably, all 5 cases of missed bacteremia occurred in infants aged 8-21 days. There were 0 missed bacteremia cases in the 22-28 day age group.

How do we reconcile this with the most current 2021 AAP guidelines?

To understand why this study is a big deal, we have to look at what the American Academy of Pediatrics (AAP) guidelines currently tells us to do. The new data exposes a potential practice shift specifically for infants in the third week of life (8–21 days).

Age GroupCurrent AAP Guidelines (2021)New PECARN Data (2025)Bottom Line for Practice
0–7 Days

Excluded

Standard of care is full sepsis workup (including LP), IV antibiotics, and admission.

Technically Included

Rule missed 0 cases of IBI in this age group, but sample size was smaller (~15% of cohort).

No Change

Due to perinatal risks and smaller sample sizes, the full sepsis workup remains a safe standard of care.

8–21 Days

Action: Routine LP required

Strategy: Full sepsis workup (including LP), IV antibiotics, and admission

Reasoning: Previously considered insufficient data

Potential to Defer LP

Meningitis: 0 missed cases

Bacteremia: 5 missed cases (all occurred in the 8–21 day window).

Nuance: High sensitivity for meningitis challenges the mandatory LP rule, but missed bacteremia warrants caution.

Proceed with Caution

While you might safely skip the LP (since 0 infants with bacterial meningitis were missed), the risk of missed bacteremia suggests these infants still require close monitoring. A reasonable approach for a well-appearing infant with normal inflammatory markers and urinalysis might be to skip the LP, give no antibiotics, but still hospitalize for observation.

22–28 Days

Action: Risk stratify

Strategy: Defer LP if inflammatory markers are normal.

Reasoning: Biomarkers considered reliable risk stratification tools for meningitis.

Evidence to Defer LP

Meningitis: 0 missed cases

Bacteremia: 0 missed cases

Strong Validation

This study supports the AAP’s existing recommendation: Skip the LP if all the PECARN criteria (UA, ANC, PCT) are negative, but admit for observation.

Additional Considerations

  1. Procalcitonin is mandatory: This rule relies on serum procalcitonin. If your facility only uses CRP and WBC, you cannot use this reduction strategy safely.
  1. Consider herpes simplex virus (HSV) meningoencephalitis: This PECARN rule is to identify young febrile infants with bacterial infections and not HSV. You thus must still risk-stratify for HSV separately (seizures, vesicles, maternal history, etc) and perform a LP if HSV is suspected, independent of the PECARN prediction rule.

Summary

For the first time, we have high-quality, multi-national data suggesting that a routine LP may not be necessary for every febrile infant ≤28 days old. While guidelines have not officially changed, this study provides the evidence needed to support shared decision-making with caregivers.

We can now honestly tell parents: “Based on these blood and urine tests, the chance of your baby having bacterial meningitis is extremely low—likely less than 1 in 2,000. We can safely hold off on the spinal tap and antibiotics right now and admit for observation.”

That is a conversation we couldn’t have yesterday.

References

  1. Kuppermann N, Dayan PS, Levine DA, et al; Febrile Infant Working Group of the Pediatric Emergency Care Applied Research Network (PECARN). A clinical prediction rule to identify febrile infants 60 days and younger at low risk for serious bacterial infections. JAMA Pediatr. 2019;173(4):342-351. doi:10.1001/jamapediatrics.2018.5501. PMID 30776077
  2. Burstein B, Waterfield T, Umana E, Xie J, Kuppermann N. Prediction of Bacteremia and Bacterial Meningitis Among Febrile Infants Aged 28 Days or Younger. JAMA. Published online December 8, 2025. doi: 10.1001/jama.2025.21454
  3. Searns JB, O’Leary ST. Moving the Field Forward to Safely Do Less With Febrile Neonates. JAMA. Published online December 8, 2025. doi: 10.1001/jama.2025.23133
  4. Pantell RH, Roberts KB, Adams WG, et al; Subcommittee on Febrile Infants. Evaluation and management of well-appearing febrile infants 8 to 60 days old. Pediatrics. 2021;148(2):e2021052228. PMID 34281996

SAEM Clinical Images Series: Strawberry Tongue

A 7-year-old male with no significant past medical history presented to the Emergency Department complaining of a sore throat. The parents stated that he had been running fevers for two days along with a worsening sore throat. The patient had been able to swallow, but had decreased oral intake secondary to pain. There are no other complaints at the time.

Vitals: BP 110/70; HR 111; R 17; T 101°F; O2 sat: 99% on room air.

General: Well appearing, no acute distress, normal voice.

HEENT: There is no sign of conjunctivitis. Oropharyngeal exam is remarkable for exudative pharyngitis with tonsillar swelling. There is no sign of peritonsillar abscess or airway compromise. Uvula midline and normal. Tongue as shown. Anterior cervical lymphadenopathy is present.

Respiratory: Clear to auscultation bilaterally.

Cardiovascular: Tachycardia without murmur.

Abdomen: Non-tender, no organomegaly.

Skin: Relevant findings as shown.

Non-contributory

Scarlet fever is caused by Group A Streptococcus (S. pyogenes), and most commonly occurs in children aged 5-15 years. The illness typically begins with a prodrome of fever, sore throat, headache, and abdominal pain, followed 1-2 days later by a distinctive coarse rash with a texture that resembles sandpaper. Exudative pharyngitis is usually present. The tongue may initially have a white coating which fades by day 4-5, revealing a bright red, “strawberry tongue” as seen in this case. The rash usually starts on the neck, axillae, and groin, and then spreads to the trunk and extremities. Pastia lines, which are linear petechial eruptions, may be present in the antecubital and axillary folds. Facial flushing with a pale area around the mouth is also common. Desquamation of the skin may occur about two weeks after the rash appears. A rapid strep test can quickly confirm the diagnosis. If scarlet fever is left untreated, it can lead to serious complications such as rheumatic fever or post-streptococcal glomerulonephritis. Early diagnosis and treatment with antibiotics, usually penicillin or amoxicillin, are effective in preventing sequelae.

Take-Home Points

  • Scarlet fever is characterized by strawberry tongue, sandpaper rash, and exudative pharyngitis. The cause is Group A Streptococcus.

  • Early diagnosis and antibiotic treatment are crucial to prevent the serious potential complications of untreated scarlet fever, such as rheumatic fever and post-streptococcal glomerulonephritis.

  • The Sanford Guide to Antimicrobial Therapy. Dallas, TX :Antimicrobial Therapy, Inc., 1995.


PEM POCUS Series: Pediatric Cardiac

PEM POCUS pediatric cardiac

Read this tutorial on the use of point of care ultrasonography (POCUS) for pediatric cardiac evaluation. Then test your skills on the ALiEMU course page to receive your PEM POCUS badge worth 2 hours of ALiEMU course credit.

Module Goals

  1. List the indications and limitations of pediatric cardiac point-of-care ultrasound (POCUS)
  2. Describe the technique for performing cardiac POCUS
  3. Identify anatomical landmarks accurately on cardiac POCUS
  4. Interpret abnormal findings on cardiac POCUS
  5. Describe the basic literature behind pediatric cardiac POCUS

Case Introduction: Child with respiratory distress

You are in the emergency department evaluating a 2-month-old full-term male infant presenting with worsening respiratory distress over the past few days. He has had no fever, rhinorrhea, congestion, or cough. He is feeding poorly and has only had two wet diapers in the past 24 hours.
On arrival, his vital signs are:

Vital SignFinding
Temperature36.4 C
Heart rate190 bpm
Blood pressure97/63
Respiratory pate62
Oxygen saturation (room air)95%

Exam

He is ill-appearing. The cardiac exam is notable for tachycardia and 2+ femoral pulses. There is no appreciable murmur. Pulmonary exam shows tachypnea, clear lungs, and mildly increased work of breathing. The abdomen is mildly distended with a liver palpable 2 cm below the costal margin. Capillary refill is 2 seconds.

Diagnostics and Management

You order a chest x-ray and labs, and order blood and urine cultures. You start a fluid bolus and empiric antibiotics. While waiting for your initial work-up, you perform a cardiac POCUS.

Cardiac POCUS can help providers rapidly identify significant cardiac pathology and drastically change management. The major POCUS questions are qualitative evaluation of:

  1. Ventricular function
  2. Pericardial effusion
  3. Relative chamber sizes
  4. Fluid tolerance (or volume status)

In the context of cardiac arrest, POCUS can assess the presence of cardiac activity. Additionally, performing repeat cardiac POCUS exams can help providers gauge response to interventions.

Limitations

Cardiac POCUS is NOT a replacement for comprehensive echocardiography. A number of applications are beyond the scope of cardiac POCUS and should be evaluated by comprehensive echocardiography, including:

  • Valvular pathology
  • Structural abnormalities
  • Congenital heart defects
  • Quantitative measurements (i.e., quantitative ventricular function, flow measurements)

Like other POCUS applications, sonographer skill and experience can influence the sensitivity/specificity of the exam to detect abnormalities.


  • Supine positioning as tolerated. Raise head of bed if needed for comfort.
    • Left lateral decubitus position can improve the A4CH and parasternal views.

Figure 1. Phased array ultrasound probe

  • Phased array probe: Smaller footprint for intercostal windows and useful for moving objects.
  • Cardiac setting on the machine (if available). Can improve temporal resolution of the images.
  • Tips for young children:
    • If fearful of staff, consider seating the child in the guardian’s lap.
    • Distract the child with a video or toy.
    • Obtain the subxiphoid view last (as this sometimes requires pressure).
    • Warmed gel can be very helpful!

A cardiac POCUS includes five standard views of the heart and inferior vena cava (below). Sonographers should recognize each of the ideal views and limitations of suboptimal views.

  • Parasternal long axis (PSLA or PLAX)
  • Parasternal short axis (PSSA or PSAX)
  • Apical four chamber view (A4CH)
  • Subxiphoid view (SUBX)
  • Inferior vena cava (IVC)

A note on probe marker orientation:

Probe marker orientation varies across pediatric disciplines, including cardiology, pediatric emergency medicine, critical care, and neonatology. This especially differs for the parasternal long axis view (discussed in more detail below). This may result in an image that appears “flipped,” or rotated 180 degrees, on the screen. Practice obtaining the views in your local environment, but also gain comfort interpreting a flipped image.

(Although all views can be used to evaluate gross ventricular function and for pericardial effusion, highlights of each view are listed below.)

Highlights of View

  • Excellent overall assessment
  • Gross LV function
  • Pericardial effusion
  • General chamber sizes

Probe Placement

Figure 2 PSLA probe placement

Figure 2. PSLA probe placement with phased array probe. (Image from Dr. Margaret Lin-Martore)

  1. Place the probe to the left of the sternum, near the 3rd-4th intercostal space.
  2. Point the probe marker towards the patient’s left hip.
  3. Slide the probe up and down intercostal spaces to obtain an ideal window.
  4. Make subtle adjustments to optimize the view.

In this image and the ones below, note that the probe is larger than a typical phased-array probe (Figure 1).

Note: The direction of the probe marker, especially for the parasternal long axis, may vary across specialties and institutions. Some specialties point the probe marker towards the left hip and others towards the right shoulder. This may result in an image that appears “flipped” (or rotated 180 degrees) on the screen.

Normal View and Landmarks

normal pediatric cardiac POCUS PSLA view

Video 1: Normal PSLA cardiac view (Image from thepocusatlas.com. Images: Dr. Lindsay Davis, Dr. Hanna Kopinski. Image Editing: Michael Amador and Dr. Matthew Riscinti)

Color labels in video:

  • Right ventricle (green)
  • Left ventricle (violet)
  • Left atrium (teal)
  • Mitral valve (yellow-brown), visualize both leaflets with the anterior leaflet centered and hitting or nearly hitting the septum
  • Aortic valve (pink)
  • Descending aorta (black circle behind pericardium)
  • Pericardium (pink), note tapering anterior to the descending aorta

Troubleshooting and Tips

  • If the left ventricle is oblique (and not horizontal across the screen), slide up a rib space.
  • The patient can hold breath in exhalation to decrease lung artifact.
  • Ensure adequate depth to see the descending aorta.
  • Try subtle micro-adjustments (fan and rotate the probe until you obtain the ideal image).
  • If the lung is obscuring the view, try rolling the patient into the left lateral decubitus position.

Normal Ultrasound Video (PSLA)

Video 2. Normal PSLA view

Highlights of View

  • Gross LV function
  • Interventricular septum position

Probe Placement

PSSA probe placement

Figure 3. Probe placement for PSSA. From the PLSA view, center the left ventricle (LV) on the screen then rotate the probe 90° clockwise towards the right hip.


Normal View and Landmarks

video normal PSSA view

Video 3: Normal PSSA view (Image from thepocusatlas.com – Dr. Lindsay Davis, Dr. Hanna Kopinski. Image editing: Michael Amador and Dr. Matthew Riscinti.)


Color labels in video:

  • Left ventricle (red)
  • Mitral valve (blue)
  • Right ventricle (top of the screen)

The ideal view is at the mid-papillary level, meaning both papillary muscles are visible in the LV at approximately 4 and 8 o’clock.  Note that this video starts with the “fish mouth” view of the mitral valve and ends with the mid-papillary view.

Additional views: Fanning through the PSSA view, starting at the apex → mid-papillary view → “fish mouth” view of the mitral valve → “Mercedes-Benz” view of the aortic valve (video 3A).

 Video 3a. Troubleshooting the PSSA view with the “PSSA sweep”


Troubleshooting and Tips

  • If you see the “fish mouth” view of the mitral valve, fan the probe towards the apex to visualize the papillary muscles.
  • If you only see one papillary muscle, anchor that side of the probe and move the other side of the probe back-and-forth (like a windshield wiper) until you find the second papillary muscle.
Video 3b. Troubleshooting the PSSA View -The Windshield Wiper:
If you cannot find the view, try sliding the probe towards the apex. Alternatively, you can return to the PSLA view and rotate from there. Rock the probe to center the LV on the screen.


Video 3c. Troubleshooting the PSSA view: Rocking the probe

Normal Ultrasound Video (PSSA)

Video 4. Normal PSSA view

Highlights of View

  • Gross chamber sizes
  • Interventricular septum position

Additional Uses:

  • Global assessment of function
  • Another view for pericardial effusion
  • Can be useful in cardiac arrest during active compressions (though SUBX most commonly used)
  • Pro tip: often helpful for advanced applications (calculations and evaluation for valvular dysfunction)

Probe Placement

Probe placement for apical 4-chamber view (A4CH)

Figure 4. Probe placement for apical 4-chamber view (A4CH). Image from Dr. Margaret Lin-Martore.

  1. From the PSSA view, slide the probe towards the apex of the heart, keeping the probe marker towards the patient’s right hip.
  2. Flatten the probe to point it towards the right shoulder.
  3. For patients with breast tissue, place the probe near the inframammary line.

Normal View and Landmarks

Normal A4CH view

Video 5: Normal A4CH view (Image from thepocusatlas.com. Images: Dr. Lindsay Davis, Dr. Hanna Kopinski. Image Editing: Michael Amador and Dr. Matthew Riscinti.)

Color labels in video:

  • Left ventricle, left atrium, mitral valve (blue, screen right)
  • Right ventricle, right atrium, tricuspid valve (red, screen left)
  • A5CH view includes the aortic outflow tract (video 5 above initially shows the A5CH view before becoming the A4CH view)
Normal A4CH view with labels

Figure 5. Normal A4CH view with labels

Troubleshooting and Tips

Ventricle differentiation: Regardless of probe marker orientation, you can still differentiate the 2 ventricles in a number of ways:

  1. The tricuspid valve inserts more apically (towards the top of the screen) than the mitral valve.
  2. The LV connects to the aortic outflow tract.
  3. The LV occupies the most apical point of the heart.
  4. The RV contains the moderator band near the apex.
Figure 5 Probe placement A4CH left lateral decub

Figure 6. Left lateral decubitus positioning for A4CH probe positioning

Optimize views:

  1. Roll the patient onto their left side (left lateral decubitus) to bring the heart towards the chest wall and decrease lung artifact (figure 5). This maneuver improves PSLA and PSSA views too, but can be essential to acquire the A4CH view.
  2. If the heart appears oblique, you are likely too medial.
    1. Slide laterally.
    2. Flatten the probe.
    3. Point the probe towards the right shoulder.

Normal Ultrasound Video

Video 6. Normal apical 4-chamber (A4CH) views

Highlights of View

  • Pericardial effusion (most sensitive view)
  • Cardiac arrest (most commonly used)

Probe Placement

Figure 6 subxiphoid view probe

Figure 7. Subxiphoid view probe placement (Image from Dr. Margaret Lin-Martore)

  1. With the probe marker pointing to the patient’s right, place the probe inferior to the xiphoid process.
  2. Switch to an overhand grip, flatten the probe, apply adequate pressure, and point towards the patient’s left shoulder.

Normal View and Landmarks

Video 7 SUBX view normal

Video 7. Normal subxiphoid view (Image from thepocusatlas.com by Dr. Lindsay Davis, Dr. Hanna Kopinski. Image Editing: Michael Amador and Dr. Matthew Riscinti)

Anatomy in video:

  • Liver (top of the screen)
  • Left ventricle and atrium (red)
  • Right ventricle and atrium (blue) (RV = most anterior chamber)

Troubleshooting and Tips

  • Position the patient supine if possible.
  • Have the patient bend knees to relax abdominal muscles.
  • Have the patient hold breath in inhalation to move the heart inferiorly.
  • Slowly apply moderate pressure to displace bowel gas. Sometimes children cannot tolerate the pressure needed for an adequate view.
  • Using the liver as an acoustic window, try sliding the probe to the patient’s right and pointing the probe towards the patient’s heart through the liver.

Pro tip: Sweeping through this view can allow further assessment for pericardial effusions

Normal Ultrasound Video

 Video 8. Normal subxiphoid view

Highlights of View

  • Rough estimate of fluid tolerance / volume status
  • Adjunct to overall hemodynamic assessment

Probe Placement

Figure 7. Probe placement for IVC transverse view

Figure 8. Probe placement for IVC transverse view. Tilt the probe perpendicular to the patient in a similar location as the subxiphoid view with probe marker to patient’s right. (Image from Dr. Margaret Lin-Martore)

Figure 8. Probe placement IVC sagittal

Figure 9. Probe placement for IVC sagittal view. Center the IVC on the screen, then rotate the probe 90 degrees with probe marker to patient’s head. Slide the probe cephalic until you see the IVC entering the right atrium.  (Image from Dr. Margaret Lin-Martore)

Notes:

  • It is important to evaluate the IVC at its maximum diameter. If you are off-axis in this view, the IVC may appear artificially narrower.
  • Practice obtaining both views, as occasionally it can be difficult to obtain one of the two views depending on patient comfort and the presence of bowel gas.

Normal View and Landmarks

Figure 9. IVC transvere view with anatomy labels

Figure 10. IVC transverse view with anatomy labels. Locate the spinal column (shadowing posteriorly). This shadowing can be seen even in a patient with a larger body habitus. Just anterior to the spinal column, locate the IVC (screen left, patient right) and abdominal aorta (screen right, patient left).

Figure 10 IVC sagittal view labelled

Figure 11. IVC sagittal view with anatomy labels. Visualize the IVC entering into the right atrium (note the hepatic vein draining into the IVC). Examine for collapsibility just distal to the hepatic vein.

Measurements

Various IVC measurements exist, including IVC collapsibility index and IVC-aorta ratio.

1. IVC Collapsibility Index

In the sagittal plane at the level of the IVC just distal to the entry of the hepatic vein, measure the maximum and minimum IVC diameters. A collapsibility index of >50% may represent volume responsiveness.

  • IVC collapsibility index = [Max IVC diameter – Min IVC diameter] / Max IVC diameter

2. IVC-Aorta Ratio

In the transverse plane near the entry of the renal vein, measure the maximum IVC and aorta diameters. Numerous cutoffs for IVC/Ao ratio exist, and can vary by patient age. An IVC/Ao ratio < 0.8 may be suggestive of dehydration.

  • IVC/Ao ratios vary by age, ranging from 0.83 (young infants) to 1.22 (older children) [1].

Please see Facts and Literature Review section for more information on IVC and volume status.

Troubleshooting and Tips

Transverse

  • Many structures can be mistaken for the IVC, including the aorta, portal vessels, and gallbladder. Locate the IVC using the spinal column (shadowing deep on the screen). In a patient without situs inversus, the IVC will be located on screen left (patient right), and the aorta is located on the other side. Both vessels may appear pulsatile, and the IVC shape can change depending on a variety of hemodynamic factors.

Sagittal

  • A common mistake is misidentifying the aorta as the IVC. The aorta is located more to the patient’s left and dives more posteriorly as it crosses the diaphragm. “Prove” that the vessel is the IVC by showing:
    1. The IVC entering the right atrium
    2. The hepatic vein draining into the IVC
  • Because the IVC is a cylindrical structure, it can look like it is completely collapsing if you are located on the edge of the vessel.

Serial IVC Exams:

  • Repeating the IVC exam after interventions (like giving a fluid bolus) can be more helpful than evaluating the IVC at a single point in time.

Normal Ultrasound Video

Video 9: Inferior vena cava (transverse view)
Video 10. Inferior vena cava (sagittal view)

Cardiac POCUS is used primarily to detect significant abnormalities, including:

  1. Gross ventricular dysfunction
  2. Pericardial effusion +/- cardiac tamponade
  3. Gross chamber dilation
  4. Completely collapsed or plethoric IVC

Left Ventricular Systolic Dysfunction

  •     Goal is to identify clinically significant moderate/severe dysfunction.
  •     Qualitative assessment is sufficient, and pattern recognition is important!
  •     As with any diagnostic test, clinical correlation is key
  •     Views: Best assessed on PSLA and PSSA
  •     PSLA:
    • Qualitative assessment of overall “squeeze,” including wall thickening and decrease in chamber size
    • Anterior leaflet of mitral valve excursion: The anterior leaflet should touch or nearly touch the interventricular septum during diastole. Adult POCUS commonly measures this distance, known as EPSS (E-point septal separation); however, age-specific norms are not yet defined in children.
      • Pitfall – An oblique view can underestimate mitral valve movement.
  •     PSSA: 
    • Qualitative assessment of overall “squeeze.”
    • The LV chamber diameter should shorten by ~1/3 and have uniform concentric contraction.

Note: Lung POCUS views may show diffuse B-lines. These vertical white lines originating from the pleura can suggest pulmonary edema in the presence of heart failure. Please see ALiEM PEM POCUS Series: Pediatric Lung Ultrasound for more information.

Ultrasound videos of severe LV dysfunction

Video 11. PSLA view – Severe LV dysfunction in a teenager with new diagnosis of cardiomyopathy. Note the poor overall squeeze, poor excursion of the anterior leaflet of the mitral valve, and lack of thickening of the LV free wall.


Video 12. PSSA view in the same patient – note the poor concentric squeeze of the left ventricle


Video 13. PSLA view – Severe LV dysfunction in a young infant presenting with failure to thrive and ALCAPA (anomalous left coronary artery from the pulmonary artery). Again note the poor overall squeeze, poor excursion of the anterior leaflet of the mitral valve, lack of thickening of the LV free wall, and dilation of the LV.


Video 14. PSSA view – Again note the poor concentric squeeze of the LV and the LV dilation.
  • Views: An effusion should be visible on multiple views.
  • SUBX view:
    • Most sensitive view
    • Pericardial effusion is located between the liver and the right ventricle.
  • PSLA view:
    • Both pericardial and pleural effusions can be seen posterior to the heart.
    • Pericardial effusions track anterior to the descending aorta.
    • Pleural effusions stop posterolateral to the descending aorta and do not cross anteriorly.

Figure 12. Pericardial and pleural effusion on PSLA view

Beware of 2 potential false positives when evaluating for pericardial effusion.

1. Pericardial fat pad

In the PSLA view, this looks like a hypoechoic rim anterior to the heart (closest to probe marker) but NOT posterior to the heart. Typically a fat pad will move in sync with the heart while an effusion does not.

Video 15. Pericardial fat pad and effusion (From thepocusatlas.com by Dr. Dimitri Livshits; Dr. Jane Belyavskaya; Dr. Chris Hanuscin)

2. “Myocardial dropout”

Myocardial dropout occurs when ultrasound waves strike cardiac muscle fibers at specific angles, causing alterations in echogenicity. This acoustic phenomenon can result in the myocardium appearing as a hypoechoic rim. It’s important to note that this rim represents actual myocardial tissue rather than an external collection such as a pericardial effusion. By adjusting the probe angle during the examination, the echogenicity of the myocardium will correspondingly shift, confirming that the hypoechoic area is indeed myocardial tissue rather than a fluid collection (e.g., pericardial effusion).

Figure 13. “Myocardial dropout” effect with asterisks marking drop out area – Changes in echogenicity of the myocardium can sometimes look like a hypoechoic rim. This rim is within the myocardium and not external to the heart as expected for a pericardial effusion. (Image: Dr. Margaret Lin-Martore)

Ultrasound videos of pericardial effusion

Video 16. Pericardial effusion (PSLA view) – The anechoic pericardial effusion is anterior to the heart and also posterior to the heart, tapering just in front of the descending aorta.
Video 17. Pericardial effusion (PSSA view) – Note the circumferential pericardial effusion. A pathologic pericardial effusion should be visualized in multiple views.
Video 18. Pericardial effusion (A4CH view) – Note the pericardial effusion at the apex, right, and left sides of the heart.
Video 19. Pericardial effusion (SUBX view) – Note the pericardial effusion between the liver and the heart. This effusion also surrounds the apex of the heart. Remember that the subxiphoid view is the most sensitive view for detecting pericardial effusion.
Video 20. Trace pericardial effusion (PSLA view) – There is a trace pericardial effusion between the LV free wall and the pericardium. A trace effusion will disappear during part of the cardiac cycle.
Video 21. Pericardial and plerual effusions (PSLA view) – Note both the pericardial and pleural effusions. The pericardial effusion tapers anteriorly to the descending aorta. The pleural effusion stops laterally / posteriorly to the descending aorta.

Definitive diagnosis of cardiac tamponade is beyond the scope of this module, and immediate specialist consultation is recommended if there is clinical concern. However, some concerning ultrasound features would include:

Features:

  1. Circumferential pericardial effusion
  2. Right atrial systolic collapse (earliest sign)
  3. Right ventricular diastolic collapse (*most specific*)
  4. Plethoric IVC

Views:

  • Any view can be used, but the A4CH view shows right-sided structures best.
Video 22. Cardiac tamponade (A4CH view)

Right ventricular function assessment is beyond the scope of this module and typically cardiac POCUS is used as a general assessment. If there is clinical concern for this, specialist consultation is recommended.

Etiologies include pulmonary hypertension, pulmonary embolism, and right heart failure.

  • Increased RV size can suggest increased right heart pressures.
  • Views: Best assessed on A4CH and PSSA.
  • A4CH:
    • A dilated RV will be equal to or larger than the LV
    • Increased RV pressures cause flattening or bowing of the interventricular septum.
  • PSSA view:
    • Increased RV pressures cause flattening of the interventricular septum.
    • “D-sign” = The LV looks like the letter “D” from septal flattening

Figure 13. The D-sign (Image from thepocusatlas.com by Drs. Ronald Rivera, Elizabeth Hanson, Melanie Malloy, Kelly Maurelius, Kings County/SUNY Downstate Emergency Medicine.)

Pitfall:

Beware the “Pseudo D-Sign”. If only one papillary muscle is in view due to probe rotation, the interventricular septum may appear artificially flattened.

Figure 14. Pseudo D-Sign

Video 23. Pseudo D-Sign mimicking right ventricular dilation
Video 24. Right ventricular dilation (PSSA view) – Note the dilation of the right ventricle and flattening of the interventricular septum (D-sign).
Video 25. Right ventricular dilation (A4CH view) – Although this video is intermittently off axis, you can still appreciate right ventricular (RV) dilation. Note the enlarged right ventricle and bowing of the inter ventricular septum into the left ventricle. In a normal heart, the RV should be approximately 2/3 the size of the LV in the apical four chamber view. In infants, the RV can be equal to the size of the LV.
Video 26 RV dilation PSLA

Video 26. RV dilation (PSLA view) – Note the enlarged right ventricle at the top of the screen.

Video 27 McConnells sign PE

Video 27. McConnell’s sign in acute massive pulmonary embolism, showing akinesia of the lateral wall of the right ventricle and hypercontractility of the apical wall. (Image from thepocusatlas.com by Dr. Kelly Maurelus, Matthew Riscinti – Kings County Emergency Medicine)

In general, IVC assessment is most useful at the extremes:

  • Completely collapsed: Walls touch with inhalation.
    • Suggests the patient may benefit from fluid resuscitation.
    • Could be consistent with hypovolemia or distributive shock.
  • Completely plethoric (full): Minimal respiratory variation.
    • Suggests the patient may not need or tolerate significant fluid resuscitation.
    • May consider other medications or treatment.
    • Could be consistent with cardiogenic or obstructive shock.

When evaluating the IVC, it is important to interpret in the overall context of the patient’s presentation. For example, a plethoric IVC with minimal XXX

Video 28. Plethoric IVC – The IVC is very large and does not change in size with respiration.
Video 29. Flattened IVC – The IVC is flat and the walls completely collapse during inspiration.

Cardiac POCUS Literature

Much of the foundation for pediatric cardiac POCUS use is extrapolated from adult studies. Marbach et al. provide an excellent summary of the adult literature and highlights that cardiac POCUS improves clinicians’ bedside diagnostic accuracy, which influences management decisions, expedites time to diagnosis, and decreases resource use [2].

Pediatric-specific studies are summarized below. In general, cardiac POCUS demonstrates adequate sensitivity and specificity in evaluating for pericardial effusion and left ventricular systolic dysfunction [3]. POCUS may even be a promising adjunct to cardiology consultation for children with a variety of preexisting cardiac conditions [4]. These studies are primarily retrospective and warrant further future study.

In pediatric septic shock, cardiac POCUS can help clinicians characterize hemodynamics and often changes clinical management [5].

When it comes to interpretation errors, learners struggle more with evaluation for cardiac dysfunction and ventricle abnormalities than for pericardial effusion [6]. Additionally, novice trainees are more likely to make interpretation errors in real-time at the bedside than when reviewing images remotely [7]. These studies may inform future educational curricula surrounding pediatric cardiac POCUS.

YearAuthorsStudy Type, N, AgesFindings
2021Hamad et al. [9]Case series

  • 10 cases
  • Age 0-21 years
Examples of acute heart failure in children
2022Miller et al. [3]Retrospective review, single center (2015-2017)

  • 456 scans
  • Median age 14.7 years (IQR 9.1-17.5)
Test characteristics for cardiac POCUS interpretation by pediatric emergency medicine (PEM) physicians for detection of pericardial effusion (16 cases) and LV systolic dysfunction (18 cases)

PEM physicians compared to POCUS experts:

  • Pericardial effusion: Sn 100% / Sp 99.5%
  • LV dysfunction: Sn 100% / Sp 99.5%

PEM physicians compared to echocardiography done within 96 hours:

  • Pericardial effusion: Sn 88% / Sp 89%
  • LV systolic dysfunction: Sn 79% / Sp 96%
2024Hoffman et al. [4]Retrospective review,
single center (2015-2017)

  • 104 scans
  • Median age 16.3 years (IQR 8.6-20.1)
Test characteristics for cardiac POCUS interpretation by (PEM physicians for detection of pericardial effusion and LV systolic dysfunction in children with preexisting cardiac disease, including:

  • Congenital heart disease
  • Acquired cardiac disease
  • Arrhythmias

PEM physicians compared to POCUS experts:

  • Pericardial effusion: Sn 100% / Sp 98%
  • LV dysfunction: Sn 100% / Sp 99%

PEM physicians compared to echocardiography done within 96 hours:

  • Pericardial effusion: Sn 88% / Sp 87%
  • LV systolic dysfunction: Sn 100% / Sp 96%

Test characteristics were lower when including technically limited studies (5/104 studies).

Limitations:

  • Possible selection bias: POCUS may have been avoided in more complex cardiac patients
  • Exams with uninterpretable images were excluded (though were not common)
  • Only 1 patient with single ventricle included
2024Scott et al. [9]Retrospective review (pilot study)

  • 21 cases (9 POCUS)
  • Median age 11.8 years (IQR 4.9-16.8)
Examined time-based metrics if POCUS used in ED for pediatric heart failure.

  • Trend towards faster time to 1st IV heart failure medication (p<0.1).
  • No difference in ED or CICU length of stay.
Table 4. Key published studies on pediatric cardiac POCUS

IVC Literature

The evidence is highly variable for using IVC measurements (size, collapsibility index, IVC/Ao ratio) in isolation for predicting fluid responsiveness or central venous pressure [11-13]. A systematic review and meta analysis suggested IVC respiratory variation did not seem to reliably predict fluid responsiveness (AUC 0.71, Sn 71%, Sp 75%) [14]; however, this review also acknowledged high study heterogeneity.

Below are a few best practices when using the IVC assessment in your clinical care:

  • Avoid using the IVC in isolation. It is a data point in the overall clinical picture of your patient.
  • IVC size is most likely helpful at the extremes (completely plethoric or completely collapsing).
  • Serial (repeated) IVC assessments can help evaluate the patient’s response to your interventions.

Case Resolution

Your cardiac POCUS (5 videos below) shows severe left ventricular dysfunction and dilation.


PSLA view

PSSA view

A4CH view

SUBX view

IVC view

The chest X-ray shows cardiomegaly with pulmonary edema. Labs are notable for severe hypocalcemia to 4.2 mg/dL (thought to be secondary to congenital hypoparathyroidism in the setting of 22q11 syndrome). The labs are otherwise unremarkable.

You suspect his cardiac dysfunction is secondary to severe hypocalcemia, give him calcium gluconate, and emergently transfer him to the nearest pediatric center with cardiac intensive care.

Note: The IVC view does have some respiratory variation, although we more commonly see a plethoric IVC in the setting of heart failure. This is a reminder to avoid making decisions based solely on the IVC view. It’s an extra data point in the overall context of the other POCUS views.

Learn More…

References

  1. Mannarino S, Bulzomì P, Codazzi AC, et al. Inferior vena cava, abdominal aorta, and IVC-to-aorta ratio in healthy Caucasian children: Ultrasound Z-scores according to BSA and age. J Cardiol. 2019;74(4):388-393. https://doi.org/10.1016/j.jjcc.2019.02.021
  2. Marbach JA, Almufleh A, Di Santo P, et al. A Shifting Paradigm: The Role of Focused Cardiac Ultrasound in Bedside Patient Assessment. Chest. 2020;158(5):2107-2118. PMID: 32707179 DOI: 10.1016/j.chest.2020.07.021
  3. Miller AF, Arichai P, Gravel CA, et al. Use of Cardiac Point-of-Care Ultrasound in the Pediatric Emergency Department. Pediatr Emerg Care. 2022;38(1):e300-e305. doi:10.1097/PEC.0000000000002271
  4. Hoffmann RM, Neal JT, Arichai P, et al. Test Characteristics of Cardiac Point-of-Care Ultrasound in Children With Preexisting Cardiac Conditions. Pediatr Emerg Care. 2024;40(4):307-310. doi:10.1097/PEC.0000000000003050
  5. Arnoldi S, Glau CL, Walker SB, et al. Integrating Focused Cardiac Ultrasound Into Pediatric Septic Shock Assessment. Pediatr Crit Care Med. 2021;22(3):262-274. doi:10.1097/PCC.0000000000002658
  6. Kwan C, Weerdenburg K, Pusic M, et al. Learning Pediatric Point-of-Care Ultrasound: How Many Cases Does Mastery of Image Interpretation Take?. Pediatr Emerg Care. 2022;38(2):e849-e855. doi:10.1097/PEC.0000000000002396
  7. Thomas-Mohtat R, Sable C, Breslin K, et al. Interpretation errors in focused cardiac ultrasound by novice pediatric emergency medicine fellow sonologists. Crit Ultrasound J. 2018;10(1):33. Published 2018 Dec 9. doi:10.1186/s13089-018-0113-4
  8. Hamad A, Ng C, Alade K, D’Amico B, et al. Diagnosing Acute Heart Failure in the Pediatric Emergency Department Using Point-of-Care Ultrasound. J Emerg Med. 2021 Sep;61(3):e18-e25. doi: 10.1016/j.jemermed.2021.03.015. Epub 2021 Jun 4. PMID: 34092442.
  9. Scott C, Alade K, Leung SK, Vaughan RM, Riley AF. Cardiac Point-of-Care Ultrasound and Multi-Disciplinary Improvement Opportunities in Acute Systolic Heart Failure Management in a Pediatric Emergency Center. Pediatr Cardiol. 2024;45(6):1353-1358. doi:10.1007/s00246-023-03125-w
  10. Ng L, Khine H, Taragin BH, Avner JR, Ushay M, Nunez D. Does bedside sonographic measurement of the inferior vena cava diameter correlate with central venous pressure in the assessment of intravascular volume in children?. Pediatr Emerg Care. 2013;29(3):337-341. doi:10.1097/PEC.0b013e31828512a5
  11. Modi P, Glavis-Bloom J, Nasrin S, et al. Accuracy of Inferior Vena Cava Ultrasound for Predicting Dehydration in Children with Acute Diarrhea in Resource-Limited Settings. PLoS One. 2016;11(1):e0146859. Published 2016 Jan 14. doi:10.1371/journal.pone.0146859
  12. Via G, Tavazzi G, Price S. Ten situations where inferior vena cava ultrasound may fail to accurately predict fluid responsiveness: a physiologically based point of view. Intensive Care Med. 2016;42(7):1164-1167. https://doi.org/10.1007/S00134-016-4357-9
  13. Orso D, Paoli I, Piani T, Cilenti FL, Cristiani L, Guglielmo N. Accuracy of Ultrasonographic Measurements of Inferior Vena Cava to Determine Fluid Responsiveness: A Systematic Review and Meta-Analysis. J Intensive Care Med. 2020;35(4):354-363. https://doi.org/10.1177/0885066617752308

Additional Reading

  • Marbach JA, Almufleh A, Di Santo P, et al. Comparative Accuracy of Focused Cardiac Ultrasonography and Clinical Examination for Left Ventricular Dysfunction and Valvular Heart Disease: A Systematic Review and Meta-analysis. Ann Intern Med. 2019;171(4):264-272. doi:10.7326/M19-1337
By |2026-05-21T10:06:40-07:00May 21, 2025|Cardiovascular, Pediatrics, PEM POCUS|
Go to Top